Laser ablation
of polymers
Laser ablation
is material removal under the action of short high intensity laser pulses.
If the laser pulses are not too short (longer than 100 ps) laser ablation
of metals can be described by
the thermal surface model. It
assumes thermal evaporation from the surface,
which proceeds with the rate proportional to the saturated vapor pressure
corresponding to surface temperature. As a result, the velocity of surface
recession is given by the Arrhenius type law:
 (1)
(1)
Application of this model to polymers
contradicts some experimental observations. It does
predict Arrhenius tails in weight loss measurements
observed near ablation threshold (onset of ablation). It does
not, however, predict sharp
ablation threshold seen on polymers in profile
measurements.
In order to reconcile
these experimental observations we developed a model
which retains Arrhenius behavior
exhibited by (1), but is capable of
predicting sharp threshold for
ablation. We assume a first order chemical reaction within
the bulk of material, which can be described by an Arrhenius
law. This reaction breaks the bonds
according to a symbolic equation.
 (2)
(2)
Here, nb is the
fraction of "broken" bonds per unit volume, 1-nb
is the fraction of "virgin" bonds. In the moving (with time dependent velocity
v)
reference frame equation of chemical kinetics reads:
 (3)
(3)
Besides, this reaction may also create
volatile species trapped within polymer matrix. These species
may leave the material long after the end of the laser pulse, thus leading
to an additional mass loss even
below the real ablation threshold. Ablation starts when the density of
broken bonds at the surface reaches a certain critical value.
 (4)
(4)
This relation defines the
position of the interface, and therefore its velocity v,
implicitly.
Radiation is absorbed
according to a linear Beer’s law with absorption coefficient a
:
 (5)
(5)
Heating is described by the one-dimensional
heat conduction equation, written in the moving
reference
frame fixed with the ablation front
 (6)
(6)
The last (Arrhenius) term in the heat equation is due
to the heat effect of reaction.
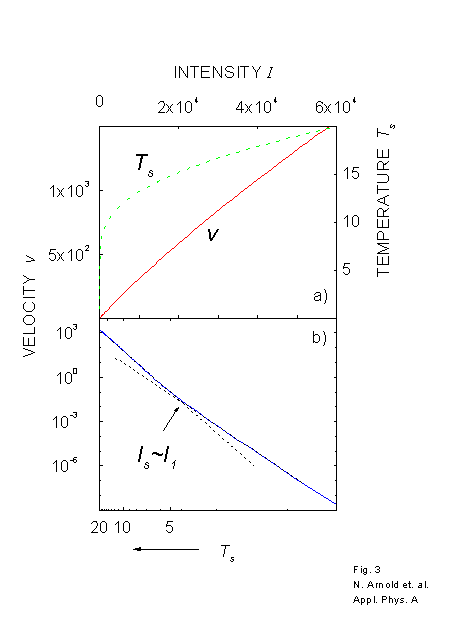
Stationary
regimes of ablation are similar to those in surface ablation models, though
the process demonstrates change of effective activation energy with laser
intensity.

Parameters of stationary
ablation for thermal volume decomposition model. a) Dependence
of stationary velocity (red solid curve) and surface temperature (green
dashed curve) on surface intensity. b) Dependence of stationary velocity
on surface temperature in Arrhenius coordinates – ln(v) vs. reciprocal
temperature (blue solid curve). Effective activation temperature for equivalent
surface reaction changes from 2/3Ta at low intensities
to Ta at high intensities. This turnover can be seen
only at the Arrhenius plot, near Ts/T0~4.
In order to understand the ablation behavior near the
threshold fluence, f
th, non-stationary
regimes are considered. The present treatment reveals several
qualitative differences with respect to models which treat
ablation as a surface process:
i) Ablation
starts sharply with a front velocity that has its maximum
value just after the onset.
ii) The transition to quasi-stationary
ablation is much faster.
iii) Near threshold, the
ablated
depth has a square root dependence on laser fluence, f
-f
th.
Ablation velocity is very big even at small (near threshold) ablated depth.
iv) With f
»
f
th,
ablation
starts well after the laser pulse.
v) The depletion
of species is responsible for the Arrhenius tail with fluences
f
£
f
th.
vi) Residual modification
of material has maximum
near the threshold.
Polyimide (KaptonTM H) is
modeled as an example. Difference between mass loss and profile measurements
of the order of 10 nm near the threshold is expected.
In order to solve the system of equation (3)-(6), which
is a system of coupled non-linear time dependent partial differential equations
with moving boundaries, a simplified method
was developed. It is based on non-stationary
spatial averaging, which reduces this system to four ordinary
differential equations for physically important parameters. The resulting
equations can be solved very fast, which allows one to study the dependence
on different factors and derive some analytical results.

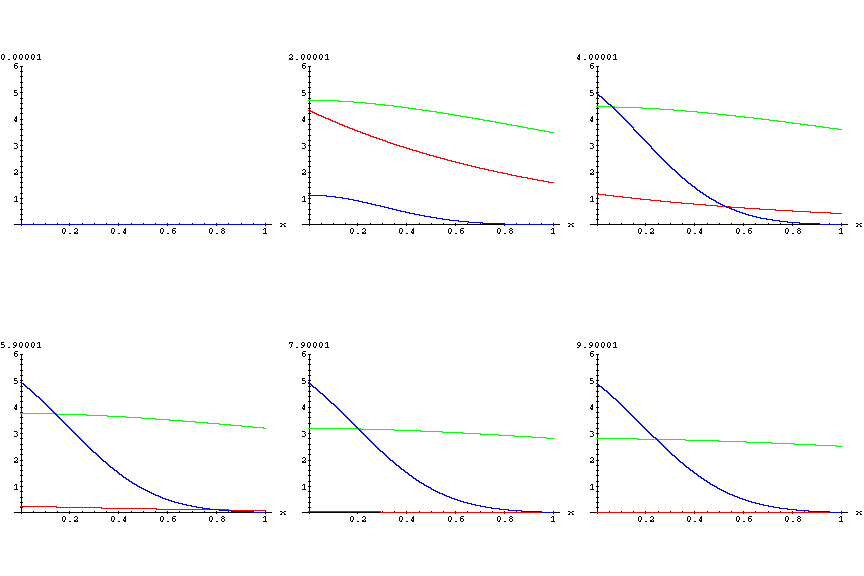
Time dependent distribution of broken
bonds (blue line), temperature (green line)
and laser intensity (red line) within the
material. Reference frame moves together with
the receding surface. Before ablation starts, the profile nb(x)
is parabolic near the surface, which leads to an explosive onset of ablation.
As interface moves, finite slope of nb(x) near the surface
is formed self-consistently.

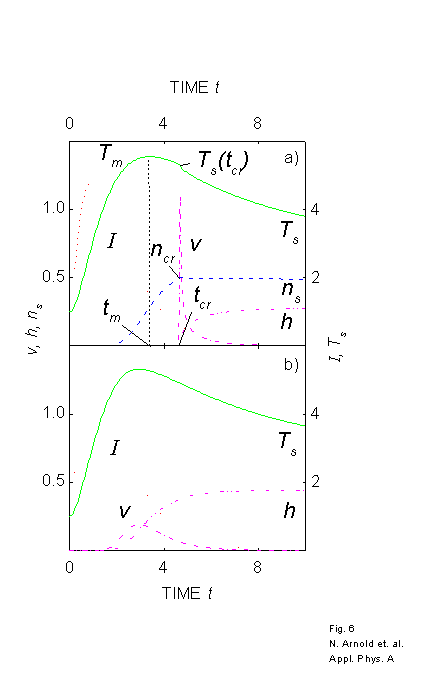
Time dependent behavior of different parameters in the
volume and surface ablation models. Laser intensity
(red dotted curve), surface temperature Ts
- green solid curve, fraction of broken bonds
at the surface ns - blue dashed curve, recession
velocity
v
- magenta dash-dot, and
ablated depth
h
- magenta dash-double dot. a) Volume model. Ablation starts sharply,
at
tcr when
ncr is reached at the surface.
Initially ablated depth has a square root behavior on time. Velocity v
is singular near onset. Ablation occurs after the pulse and after
the maximal surface temperature Tm was reached at tm.
Despite small total ablated depth, ablation velocity is very high. b) Surface
model. Maximum of velocity corresponds to maximum in surface temperature
and velocity is small near the threshold.

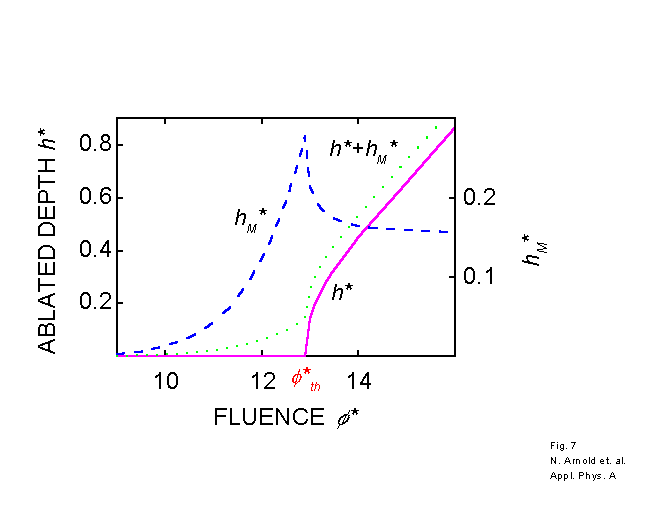
Contributions of mass loss via volatile
species hM (blue dashed line) and real
ablation h (magenta solid line) to the overall
effective ablated depth ht=hM+h
(green
dotted line). Arrhenius tails are due to volatile species,
real ablation starts sharply. Modification of material and loss of volatile
species hM have a sharp maximum near f
th.
Home
 (1)
(1)
 (2)
(2)
 (3)
(3)
 (4)
(4)
 (5)
(5)
 (6)
(6)


